OpenCv 基础函数
读取图片
1

img = cv.imread('img.png', 0)
- 0:灰度图模式加载
- 1:正常加载图片
展示图片
1
2
3

cv.imshow('image', img)
cv.waitKey(0)
cv.destroyAllWindows()

waitKey(0) 表示等待按任意键继续执行,destroyAllWindows()销毁所有窗口
裁剪
1
2
3
4
5

img = cv.imread('img.png', 0)
show = img[80:350, 170:400]
cv.imshow('image', show)
cv.waitKey(0)
cv.destroyAllWindows()

img[80:350, 170:400]表示截取y轴80-350和x轴170-400范围内的图片区域
打印图片
正常打印
1
2

img = cv.imread('img.png', 1)
print(img)
这里打印图片,可以看到正常图片为三维数组,每个值为对应位置的rgb值
1
2
3
4
5
6
7
8
9
10
11
12
13
14
15

[[[236 235 237]
  [237 236 238]
  [238 237 239]
  ...
  [ 90 113 145]
  [ 89 112 144]
  [ 89 112 144]]
  ...
 [[170 182 200]
  [170 182 200]
  [170 182 200]
  ...
  [ 13  20  35]
  [ 13  20  35]
  [ 13  20  35]]]
灰度打印
1
2

img = cv.imread('img.png', 0)
print(img)
灰度图片则为二维数组,对应位置的灰度值
1
2
3
4
5
6
7

[[235 236 237 ... 119 118 118]
 [234 235 236 ... 119 119 119]
 [235 236 237 ... 119 119 119]
 ...
 [187 187 186 ...  23  23  24]
 [187 187 186 ...  23  23  24]
 [186 186 186 ...  23  23  23]]
opncv的操作几乎都是对图片像素点的一些处理操作。
图像处理
阈值与平滑处理
1
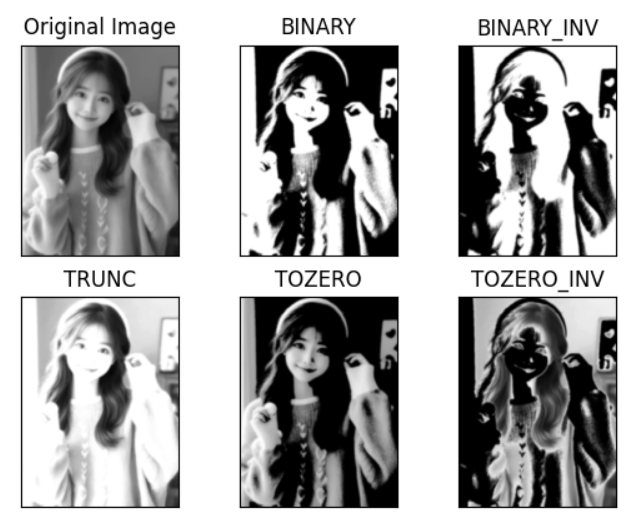
def threshold(src, thresh, maxval, type)
-
src:输入图 -
thresh:阈值 -
maxval:超过或低于阈值时所得到的值,由type决定 -
type:-
cv.THRESH_BINARY:超过阈值部分取maxval,否则为0 -
cv.THRESH_BINARY_INV:大于阈值的取0,否则为maxval -
cv.THRESH_TRUNC:大于阈值部分取阈值,否则不变 -
cv.THRESH_TOZERO:小于等于阈值部分取0,否则不变 -
cv.THRESH_TOZERO_INV:大于阈值部分取0,否则不变
-
1
2
3
4
5
6
7
8
9
10
11
12
13
14
15
16
17
18
19
20

import cv2 as cv
from matplotlib import pyplot as plt

if __name__ == '__main__':
    img = cv.imread('img.png', 0)
    _, th1 = cv.threshold(img, 127, 255, cv.THRESH_BINARY)
    pr
    _, th2 = cv.threshold(img, 127, 255, cv.THRESH_BINARY_INV)
    _, th3 = cv.threshold(img, 127, 255, cv.THRESH_TRUNC)
    _, th4 = cv.threshold(img, 127, 255, cv.THRESH_TOZERO)
    _, th5 = cv.threshold(img, 127, 255, cv.THRESH_TOZERO_INV)
    titles = ['Original Image', 'BINARY', 'BINARY_INV', 'TRUNC', 'TOZERO', 'TOZERO_INV']
    images = [img, th1, th2, th3, th4, th5]

    for i in range(6):
        plt.subplot(2, 3, i + 1)
        plt.imshow(images[i], cmap='gray', interpolation='bicubic')
        plt.title(titles[i])
        plt.xticks([]), plt.yticks([])
    plt.show()